

Why Conduct Memory Forensics?
Sometimes, after a system has been compromised or hacked, it's important to extract forensically-relevant information. Random Access Memory (RAM) is considered volatile - meaning that it doesn't live long. Each time a computer is restarted, it flushes its memory from RAM. That means that, if a computer is hacked or compromised and is restarted, you'll lose a lot of information that tells the story about how the system was compromised.
Using a tool like Volatility to analyze a memory dump helps discover evidence of an attack. But before you can even use Volatility, you'll need to capture the memory using another tool like winpmem.
Background Information
In this blog, I'll be going over how to capture Windows memory using winpmem and how to analyze it with Volatility. I set up a virtual Windows machine for a CTF I ran back in 2018 called Guardians CTF; you'll see some references to it as I walk through my analysis. I simulated an attack where I, as the attacker, uploaded netcat as a listener. Nothing too fancy, I just wanted to showcase how to distinguish legitimate and illegitimate processes. Then, using Volatility on Kali, I'll walk through how to analyze the raw memory dump.
Capturing Windows Memory Using Winpmem
Winpmem is a part of the Pmem Suite, a suite of memory acquisition tools for Windows, Linux, and Mac OS. You can download the latest release of winpmem from here: https://github.com/Velocidex/c-aff4/releases.
Run Winpmem
First, after I staged my malicious activity, I downloaded winpmem 3.3 RC3 onto the victim Windows machine. From there, I opened a command-line terminal and executed the program:
C:\ winpmem_v3.3.rc3.exe --output memdump.raw --format raw --volume_format rawThe --output mem.raw option was used to name the output as memdump.raw. The --format raw and --volume_format raw options were used to output the memory in raw format (as opposed to something like aff4). After several minutes, the memory dump finished. I then transferred the raw memory file, memdump.raw, to my Kali machine.
Installing Volatility
Now that my raw memory file was on my Kali machine, was ready to use Volatility. This tool comes packaged with Kali, but if you're using a machine that does not already have Volatility installed, you can install it on using a package manager. If you use apt like I do, you can run this command on a Linux machine to install Volatility:
sudo apt install volatility -yAnalyzing Windows Memory Using Volatility
Choosing the Right Profile
This part frustrates a lot of analysts. You can typically only analyze memory dumps that have a profile available in Volatility. Newer Windows 10 builds do not have compatible profiles in Volatility. For the sake of my demo, I used an older Windows 10 build (10586). You can obtain older Windows 10 builds from https://uupdump.ml/.
To find the right profile, type volatility --info to get a list of the available profiles. If you look under "Profiles" in the output, you'll see the following Windows 10 profiles:
Profiles
--------
[...]
Win10x64              - A Profile for Windows 10 x64
Win10x64_10240_17770  - A Profile for Windows 10 x64 (10.0.10240.17770 / 2018-02-10)
Win10x64_10586        - A Profile for Windows 10 x64 (10.0.10586.306 / 2016-04-23)
Win10x64_14393        - A Profile for Windows 10 x64 (10.0.14393.0 / 2016-07-16)
Win10x64_15063        - A Profile for Windows 10 x64 (10.0.15063.0 / 2017-04-04)
Win10x64_16299        - A Profile for Windows 10 x64 (10.0.16299.0 / 2017-09-22)
Win10x64_17134        - A Profile for Windows 10 x64 (10.0.17134.1 / 2018-04-11)
Win10x86              - A Profile for Windows 10 x86
Win10x86_10240_17770  - A Profile for Windows 10 x86 (10.0.10240.17770 / 2018-02-10)
Win10x86_10586        - A Profile for Windows 10 x86 (10.0.10586.420 / 2016-05-28)
Win10x86_14393        - A Profile for Windows 10 x86 (10.0.14393.0 / 2016-07-16)
Win10x86_15063        - A Profile for Windows 10 x86 (10.0.15063.0 / 2017-04-04)
Win10x86_16299        - A Profile for Windows 10 x86 (10.0.16299.15 / 2017-09-29)
Win10x86_17134        - A Profile for Windows 10 x86 (10.0.17134.1 / 2018-04-11)
[...]
As I mentioned earlier, I used Windows 10 64-bit (10586). If you look at the output above, this is the third option that appears.
Analyzing Processes
I used the pslist plugin to look at the processes that were running on the Windows computer at the time the memory was captured.
volatility -f memdump.raw --profile=Win10x64_10586 pslistFor the sake of saving screen space, I won't pose the entire process list here, but you can check it out on pastebin. Here's a watered-down list that shows legitimate processes with the malicious processes mixed in. See if you can spot which ones are the malicious ones.
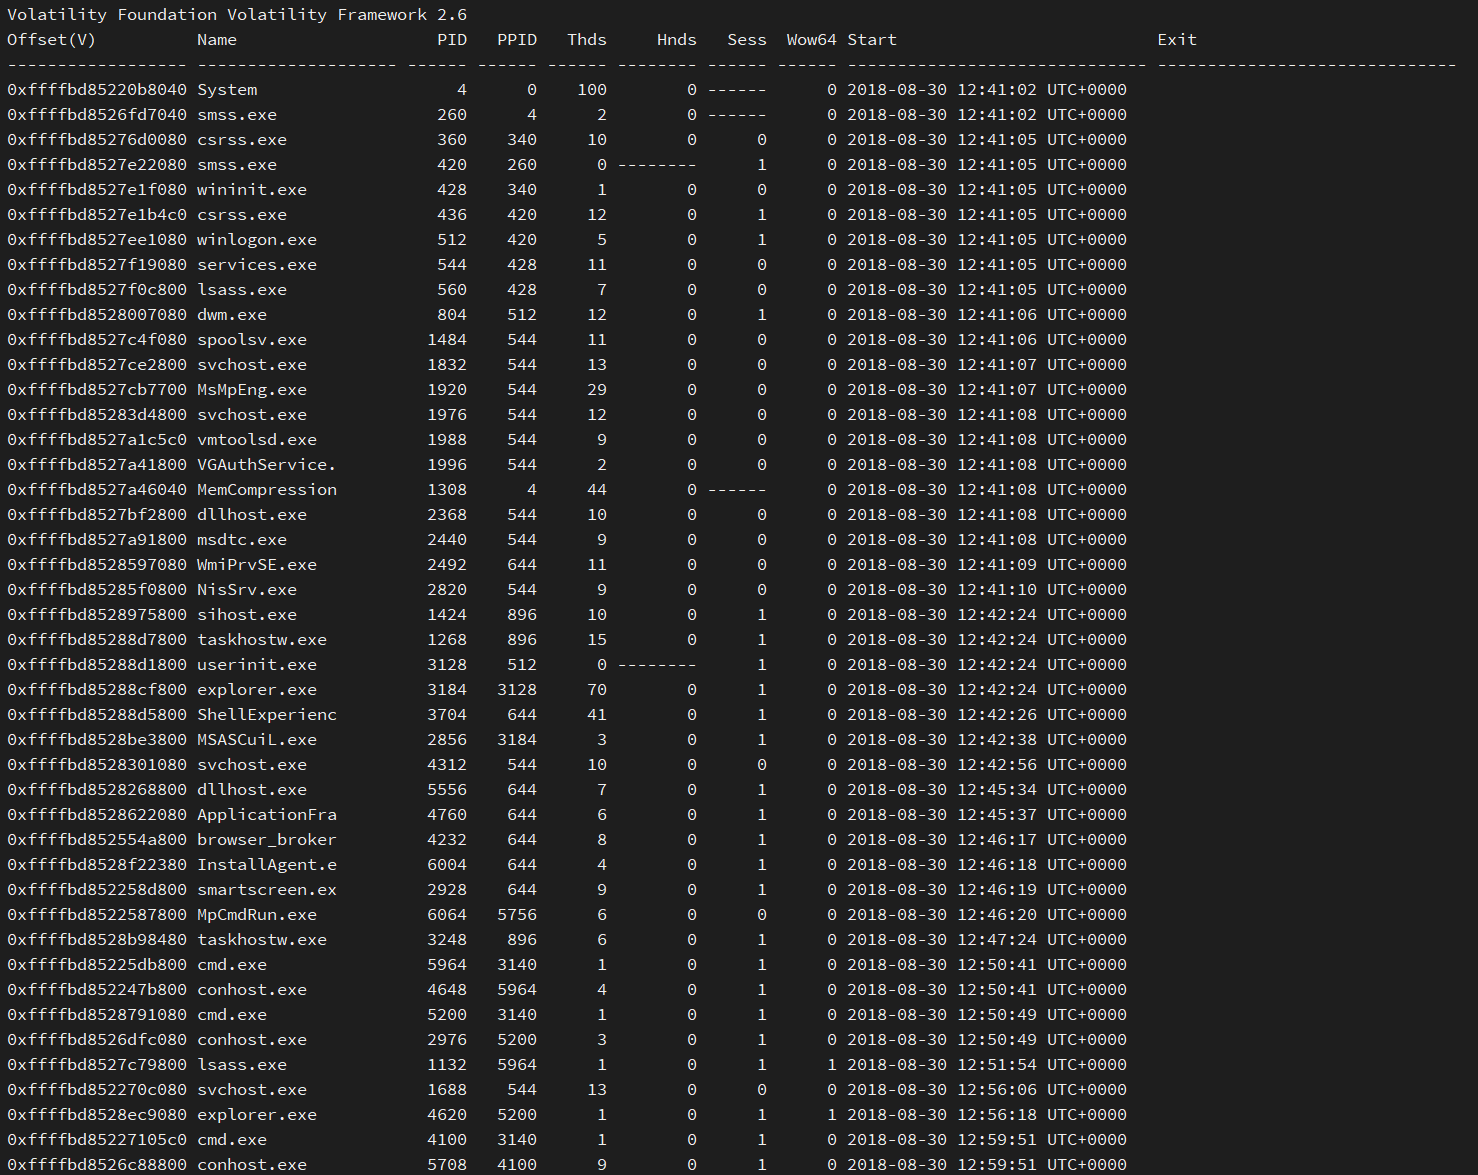
One thing that stands out after looking at these processes is that there are two instances of lsass.exe. If you're not familiar with lsass, it's the Local Security Authority process in Windows that's responsible for enforcing security policy on the machine. There should only ever be one instance of lsass on a Windows machine. Because it's crucial to the operation of Windows, attackers often masquerade their malware as lsass.
So, with that information, we can try to investigate to determine which lsass is the legitimate one. Let's start by seeing which parent process, or PPID, launched each instance of lsass. The lsass at the top of the list (PID 560) has a PPID of 428, which is wininit.exe. This process is responsible for starting crucial services like lsass, Service Control Manager (services.exe), and Local Session Manager (lsm.exe). This is a legitimate lsass process.
Let's look at the other lsass with a PID of 1132 and a PPID of 5964. Looking at the list, PID 5964 is cmd.exe, which is a command-line executable. The lsass process wouldn't be launched by cmd, which means this is most likely our malicious executable. There's still another malicious process and we can do more investigation by checking out the machine's network connections.
Analyzing Network Connections
Another plugin I used was netscan. This plugin allows you to see the network connections on the machine at the time the memory was captured. I ran the plugin with volatility and directed the output to netscan.txt.
volatility -f memdump.raw --profile=Win10x64_10586 netscan > netscan.txtFirst, I looked for any processes that were listening on a non-standard port.
head -n 1 netscan.txt; grep -i "listening" netscan.txtThis is the result of the command - a list of processes listening on a port:
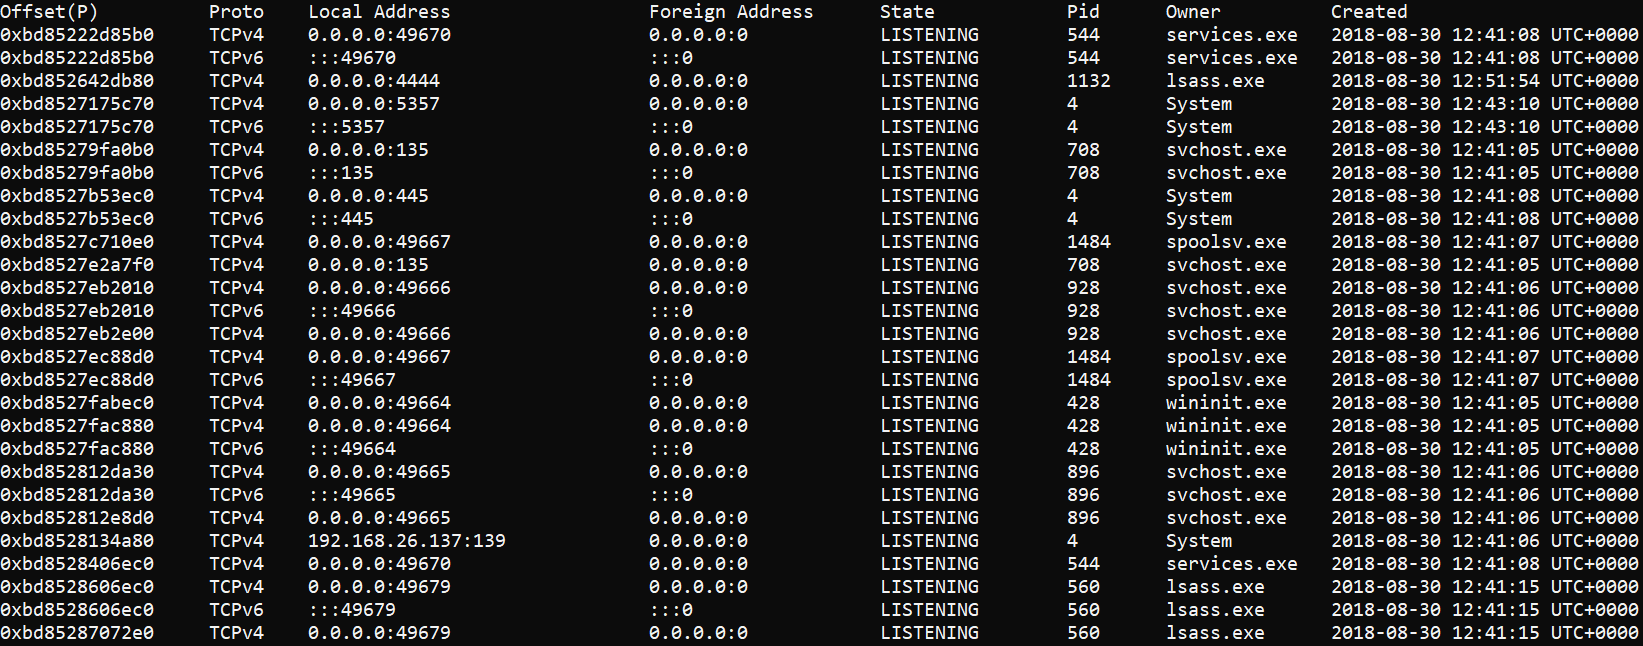
We know that lsass with PID 1132 is malicious, and we can see from the output above that it is listening on port 4444. What makes this significant? Well, TCP port 4444 is the default port used by metasploit, a framework commonly used by attackers to craft and launch exploits.
Next, I looked at established connections to see if any malicious processes already had an established connection.
head -n 1 netscan.txt; grep -i "established" netscan.txt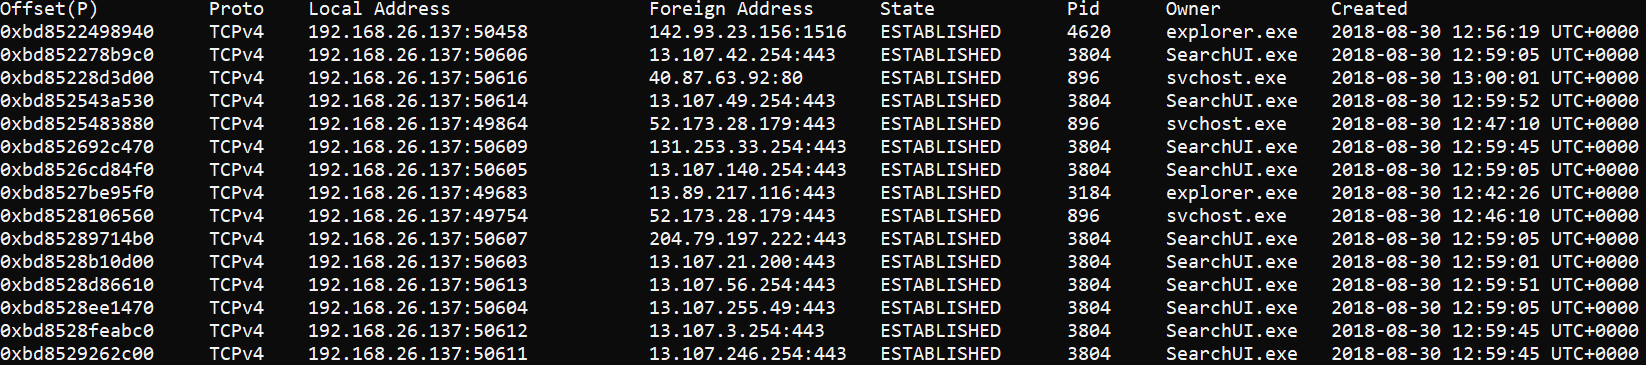
This one might be a little trickier to spot at first. At the top of the list is explorer.exe which has an established connection on TCP port 1516. There is another instance of explorer.exe farther down the list with an established connection on TCP port 443 (Secure HTTP, or HTTPS). So, what is TCP port 1516 and why does the first explorer.exe have an established connection to it?
In the next step, I performed a whois on both IP addresses with established connections to explorer.exe.
whois 13.89.217.116Looking at the output, we can see that this IP address belongs to Microsft. So, this is a legitimate connection.
[...]
NetRange:       13.64.0.0 - 13.107.255.255
CIDR:           13.104.0.0/14, 13.96.0.0/13, 13.64.0.0/11
NetName:        MSFT
NetHandle:      NET-13-64-0-0-1
Parent:         NET13 (NET-13-0-0-0-0)
NetType:        Direct Assignment
OriginAS:
Organization:   Microsoft Corporation (MSFT)
RegDate:        2015-03-26
Updated:        2015-03-26
Ref:            https://rdap.arin.net/registry/ip/13.64.0.0
[...]
Next, I conducted a whois on the first connection using the same command from above. This time, however, the output showed that the IP was associated with Digital Ocean.
Now, Digital Ocean is NOT a malicious service; it's a legitimate hosting platform. But, in this example, there is no legitimate need for a Digital Ocean IP to have an established connection with the Windows Explorer: (explorer.exe). This is an example of using a Virtual Machine hosted on Digital Ocean to establish C2 (Command and Control).
[...]
NetRange:       142.93.0.0 - 142.93.255.255
CIDR:           142.93.0.0/16
NetName:        DIGITALOCEAN-142-93-0-0
NetHandle:      NET-142-93-0-0-1
Parent:         NET142 (NET-142-0-0-0-0)
NetType:        Direct Allocation
OriginAS:       AS14061
Organization:   DigitalOcean, LLC (DO-13)
RegDate:        2018-07-12
Updated:        2020-04-03
Comment:        Routing and Peering Policy can be found at https://www.as14061.net
Comment:
Comment:        Please submit abuse reports at https://www.digitalocean.com/company/contact/#abuse
Ref:            https://rdap.arin.net/registry/ip/142.93.0.0
[...]
Looking at Command-Line History
The next thing I did was looked at the command-line history using the cmdline plugin. Using the plugin, I was able to see what commands were executed at the time that the memory was captured.
volatility -f memdump.raw --profile=Win10x64_10586 cmdline > cmdline.txtOf note, I found the following suspicious commands:
[...]
************************************************************************
lsass.exe pid:   1132
Command line : lsass.exe  -lnvp 4444
************************************************************************
[...]
************************************************************************
explorer.exe pid:   4620
Command line : explorer.exe  mtnpeak.guardiansctf.com 1516
************************************************************************
[...]
The first finding shows our malicious lsass using the options -lnvp 4444. If this doesn't look familiar, those are options commonly used with netcat to set up a listener. Using TCP port 4444, as I mentioned earlier, is a dead giveaway that it's probably malicious.
The second finding shows that explorer.exe was launched and was given two arguments: mtnpeak.guardiansctf.com and 1516. We know from earlier that 1516 is the TCP port that the explorer.exe process established a connection to. The other argument, mtnpeak.guardiansctf.com is a subdomain for the CTF I mentioned at the beginning of this blog. This is the host to which the explorer.exe process is connecting.
Conclusion
Using software like Volatility to analyze the memory of a compromised system can be very useful. You can sift through the various processes that were present on the system, and you can even see its network connections. You can also look at command-line history to help paint the picture of the events that occurred during an attack.
In the next blog, I'll go over how to extract files and password hashes from a memory dump with Volatility.